Skip to content
Home / Services / Graphics & Branding / Data visualization (1 chart/graph)
Graphics & Branding • Toronto & the GTA

Data visualization (1 chart/graph)

Data visualization (1 chart/graph): Make a visual message instantly legible with a clear next move. This page is about data visualization (1 chart/graph), not a generic substitute.

$67 flat

How it works
AI-generated brand identity concept for Data visualization (1 chart/graph); illustrative, not client workAI concept made by contentto.ca

Sound familiar?

Businesses usually reach for data visualization (1 chart/graph) when the message is important but the current version makes people work too hard to understand it. The fix is to give the information a sharper order and a more deliberate destination. That distinction matters particularly for a data visualization (1 chart/graph) brief.

Data visualization (1 chart/graph) is a practical choice when you need to make a visual message instantly legible. We shape the work around a viewer deciding whether the idea feels credible, the facts your business can stand behind, and the channel where the finished asset will be used. The result is not a recycled agency paragraph; it is a purpose-built piece with a clear role in the customer journey. Expect delivery within 24-72 hours from a complete brief. For data visualization (1 chart/graph), the emphasis is on the details that distinguish this exact order from the rest of the catalog.

What you get

Creative direction & deliverables

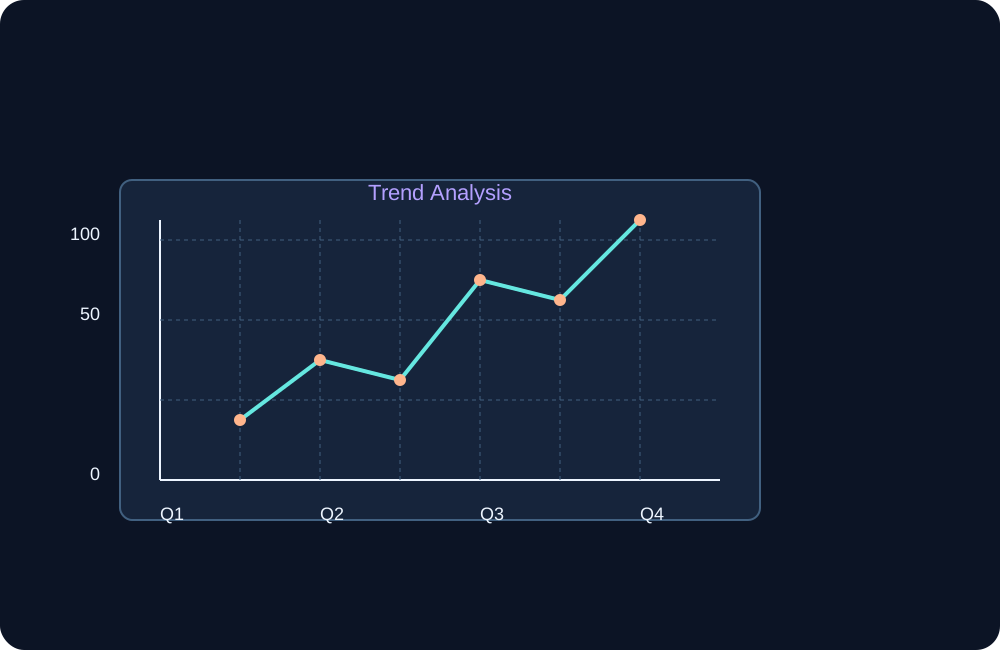
Single Chart Design - illustrative service conceptIllustrative concept made by contentto.ca
Illustrative service-specific concept, not a finished client deliverable. One clean graph with labeled axes and data points
What lands in your inbox

Data visualization (1 chart/graph) is a practical choice when you need to make a visual message instantly legible. We shape the work around a viewer deciding whether the idea feels credible, the facts your business can stand behind, and the channel where the finished asset will be used. The result is not a recycled agency paragraph; it is a purpose-built piece with a clear role in the customer journey. Expect delivery within 24-72 hours from a complete brief. For data visualization (1 chart/graph), the emphasis is on the details that distinguish this exact order from the rest of the catalog.

Deliverables and file formats follow the scope listed on this page. Send your brief and feedback digitally; one revision round is included.

Why it is worth it

✨ Data visualization (1 chart/graph) gives a viewer deciding whether the idea feels credible a more direct route to the information that matters. For this data visualization (1 chart/graph) order, that means a more useful result.

✨ The finished work can be understood by people, search systems, and AI assistants. For this data visualization (1 chart/graph) order, that means a more useful result.

✨ Local context can be included when Toronto, the GTA, or another service area matters. For this data visualization (1 chart/graph) order, that means a more useful result.

✨ Your team gets a usable asset rather than another draft to decode. For this data visualization (1 chart/graph) order, that means a more useful result.

Why let us do it

Rather than adding noise, this service gives one important message a deliberate shape. For data visualization (1 chart/graph), that means prioritizing make a visual message instantly legible before adding decorative detail. In this service, the practical test is whether the finished data visualization (1 chart/graph) earns its place in the customer journey.

Pairs perfectly with

Social media profile pic

Social media profile pic: Give a platform audience a reason to stop, understand, and respond with a clear next move. This page is about social media profile pic, not a generic substitute.

$47.00

See it →

Color palette development

Color palette development: Make a visual message instantly legible with a clear next move. This page is about color palette development, not a generic substitute.

$97.00

See it →

Browse all Graphics & Branding →

Questions? Answered.

Who is this for? (Data visualization (1 chart/graph))

It is suited to a business that needs make a visual message instantly legible and already knows the basic offer it wants to communicate. For data visualization (1 chart/graph), we will keep the answer tied to your actual offer and audience.

What makes the work useful? (Data visualization (1 chart/graph))

The output is planned around a viewer deciding whether the idea feels credible, the intended channel, and the next action rather than around a generic format. For data visualization (1 chart/graph), we will keep the answer tied to your actual offer and audience.

What do you need from me? (Data visualization (1 chart/graph))

Send the offer details, audience, source material, brand references, and any required facts; we will identify the clearest editorial route. For data visualization (1 chart/graph), we will keep the answer tied to your actual offer and audience.

How is the final adjustment handled? (Data visualization (1 chart/graph))

One revision is included, with consolidated notes used to make a focused final adjustment. For data visualization (1 chart/graph), we will keep the answer tied to your actual offer and audience.

Can it support SEO, AEO, and GEO? (Data visualization (1 chart/graph))

Yes, where relevant: the work uses clear entities, direct answers, natural language, and location context without making ranking guarantees. For data visualization (1 chart/graph), we will keep the answer tied to your actual offer and audience.

Q: How much does data visualization (1 chart/graph) cost in Toronto? A: Content T.O offers Data visualization (1 chart/graph) at a flat $67 CAD, 100% digital, no contracts or meetings. Data visualization (1 chart/graph): Make a visual message instantly legible with a clear next move. This page is about data visualization (1 chart/graph), not a generic substitute.

Bring us the offer, audience, and outcome behind your data visualization (1 chart/graph); we will turn that brief into a clearer next move. Tell us the one result that would make this data visualization (1 chart/graph) worth buying.

Data visualization (1 chart/graph) — $67 flat, 100% digital, no contracts.